What Are Analytics Tools for Musicians
What Are Analytics Tools. Discover what analytics tools are and how they help music artists track streams, engagement, and revenue

October 1, 2026
Music Marketplace Advisor
Buying & SellingThe global analytics software market reached an estimated USD 30.7 billion in 2024, showing that analytics tools are critical infrastructure for modern business, including music. Analytics tools collect, organize, and interpret audience and commercial activity so artists can replace guesswork with decisions about releases, promotion, touring, and revenue.
Your album is live. The cover looks sharp, the mixes are finished, and the distributor says the release went through. A week later, you can see plays, likes, and followers, but you still don't know which post brought listeners in, whether anyone saved the record, or if the people streaming it would buy a ticket.
That gap is where independent artists lose time. A large stream count can feel like proof of progress, yet it may say very little about who cares enough to return, subscribe, attend, or buy. Analytics tools turn scattered signals into a usable picture of your music business.
What Are Analytics Tools
Analytics tools are software systems that track activity, measure outcomes, reveal patterns, and support action. In music, they can connect a listener's first click with a stream, a follow, a comment, a subscription, a ticket purchase, or a merch order. The value isn't the chart itself. The value is knowing what the chart should change.
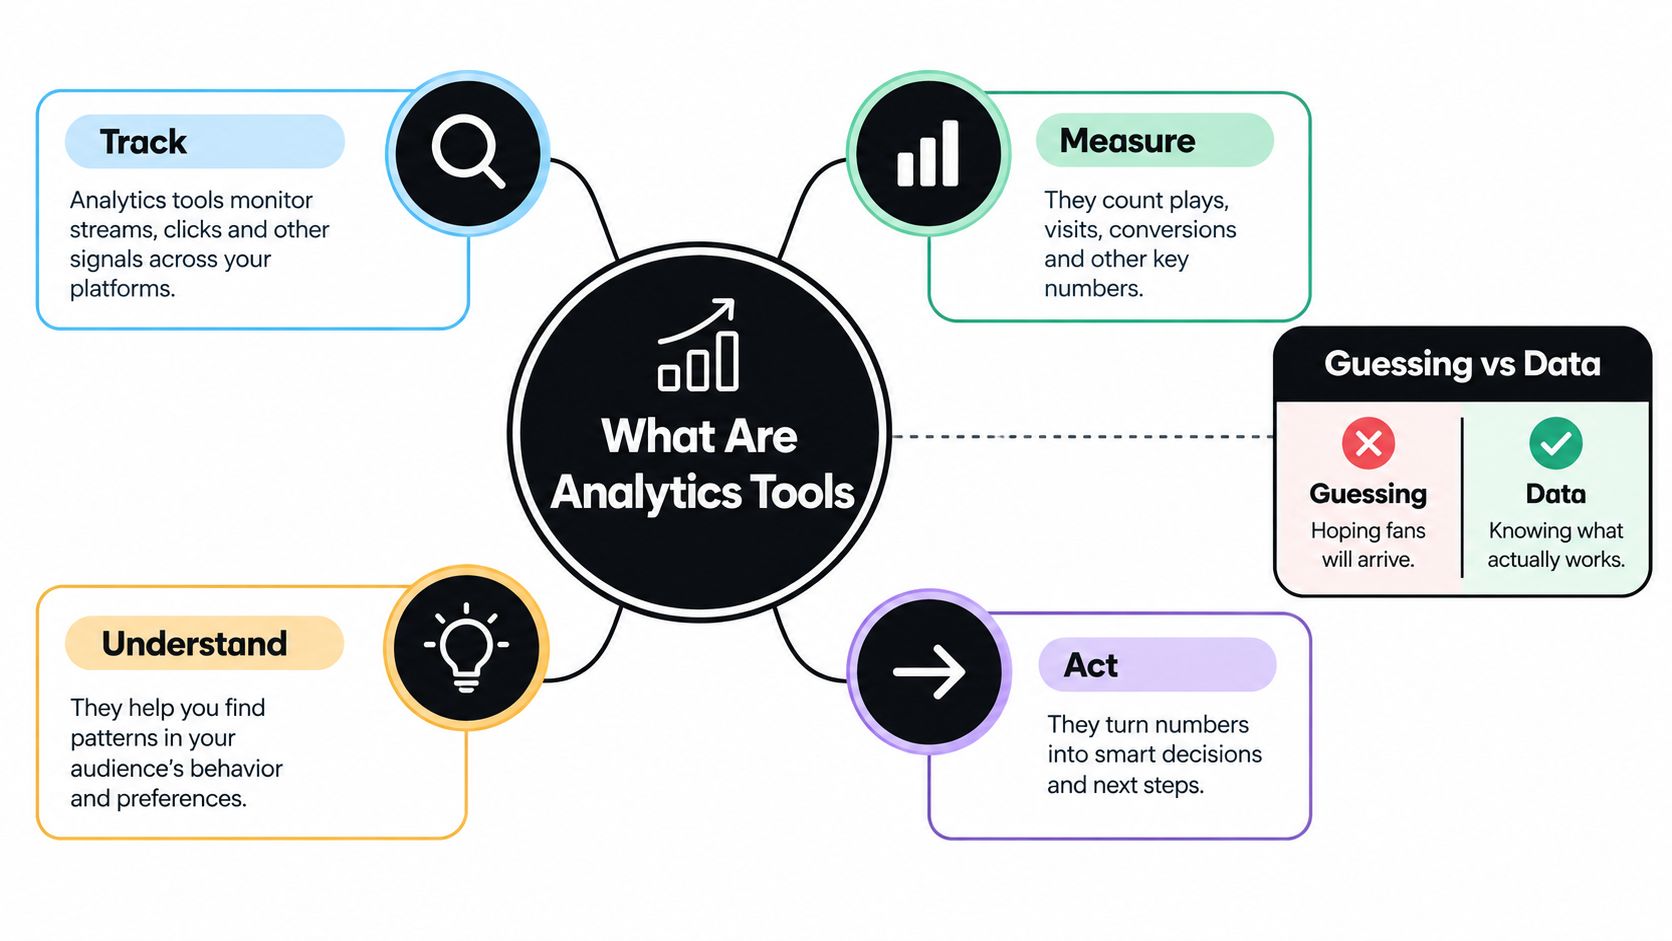
Consider an independent singer releasing an EP. A streaming dashboard might show where plays occurred. A website analytics tool may show the referral source. A store report can reveal which visitors purchased a shirt. A community platform can show whether those fans continued engaging after release week. Each system answers part of the question, but the artist needs the connected story.
From noise to a working map
Analytics tools sit above raw data and pipelines, turning prepared information into dashboards, reports, research, and self-serve business intelligence assets, as explained in Mode's overview of analytics tools. That means they aren't merely decorative chart makers. They package definitions, comparisons, trends, and recurring views that other people can use to make decisions.
A reporting tool answers a known question, such as whether this month's sales exceeded the previous period. An analysis tool helps investigate an unexpected change, such as why one city suddenly shows stronger engagement or why listeners stop returning after a particular campaign. Music teams often need both.
Practical rule: A metric becomes useful only when you know what decision it can influence.
The global analytics software market was estimated at USD 30.7 billion in 2024, forecast to reach USD 32.4 billion in 2025, and projected to reach USD 55.6 billion by 2035, with a 5.6% CAGR during 2026 to 2035, according to Wise Guy Reports' analytics software market overview. That scale matters because it places music analytics inside a broader operational category, not in a niche reserved for major labels.
Good dashboards also tell stories. Artists who want to make reports more understandable can study practical guidance on creating compelling data stories, then apply the same principle to release reporting. Don't show every available number. Show the few signals that explain what happened and what you should do next.
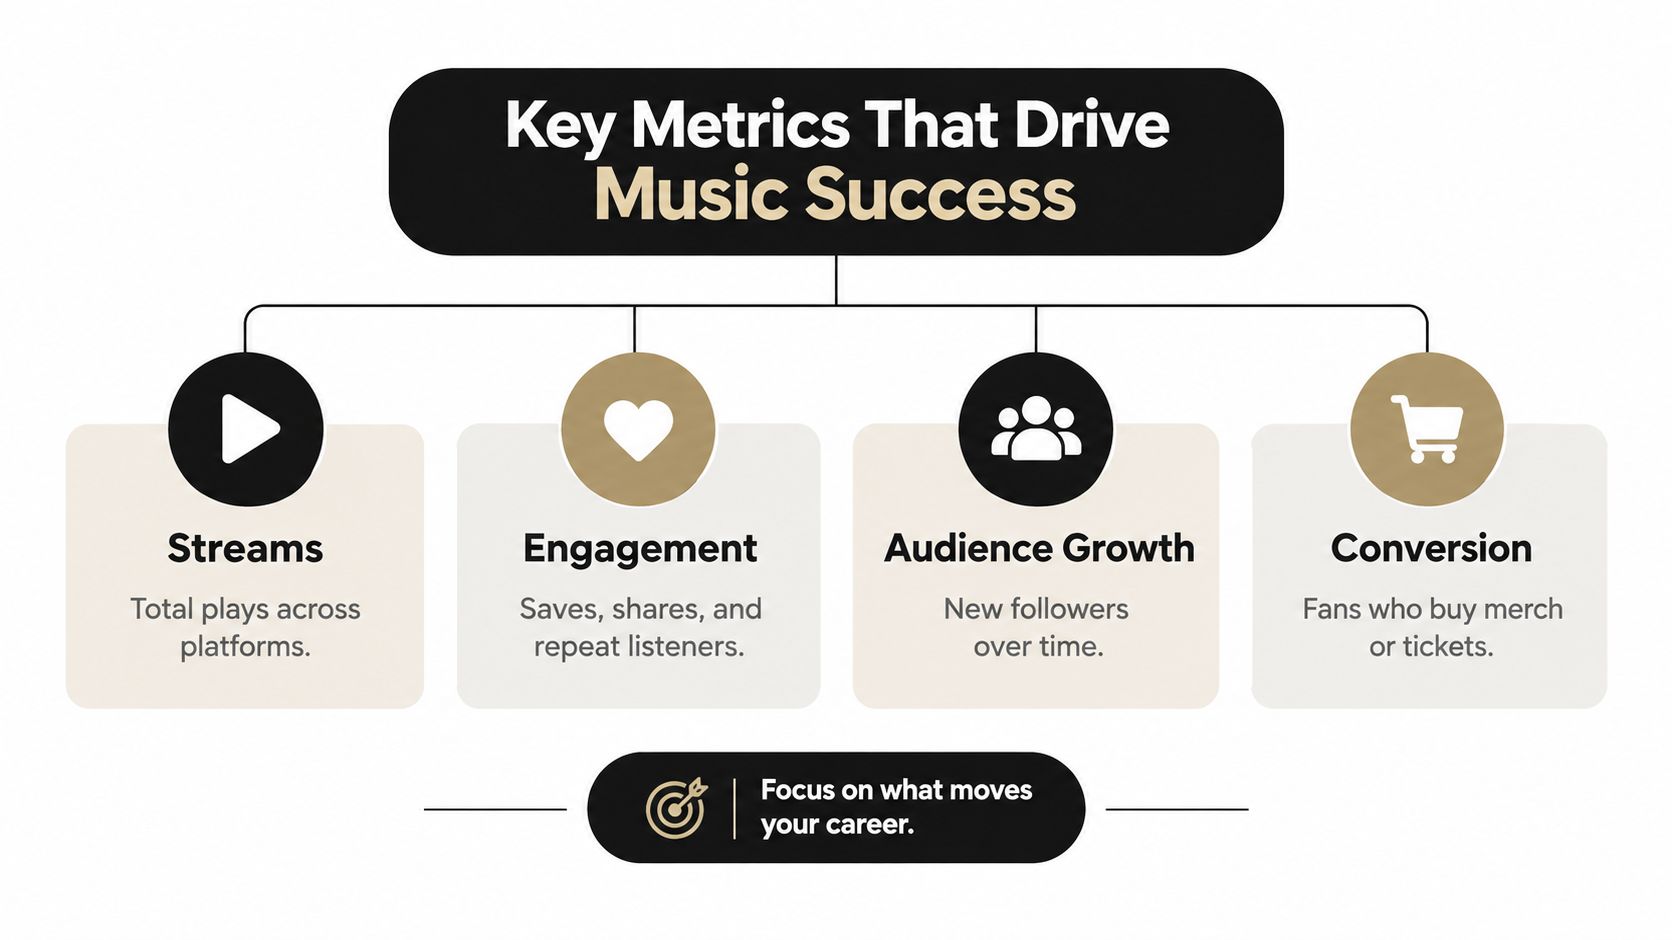
Key Metrics That Drive Music Success
Not all music metrics deserve equal attention. Streams measure reach, but reach alone doesn't establish a relationship. A healthier view follows the path from exposure to response, then from response to commercial support and repeat behavior.
Streams show distribution
Streams help you understand whether a track is being discovered and where activity is concentrated. Use them to compare songs, campaigns, territories, and sources, but don't treat a play as a committed fan. A playlist-driven spike may create attention without producing follows, saves, direct visits, or sales.
The useful question is not just, “How many plays did this track get?” Ask which release attracts the strongest downstream behavior and whether the source keeps delivering listeners who return.
Engagement shows connection
Saves, shares, comments, repeat listening, and follows reveal more intent than passive reach. Engagement isn't identical across platforms, so define what each action means for your workflow. A share can expand discovery, while a save may signal that the listener plans to return.
Track engagement beside the content that generated it. A short video, live clip, lyric post, or personal story may attract different responses even when each promotes the same song.
Audience growth needs context
Follower growth tells you whether your public audience is expanding, but the total can become a vanity metric if you don't examine activity afterward. Look for new followers who listen, respond, join your owned channels, or attend events.
Audience analytics tools are commonly layered rather than singular. A 2026 web analytics summary reported that analytics tools appeared on 47.6% of websites, while 70.3% of those sites used one analytics tool, 22.5% used two, and 7.3% used three or more, as reported by Analyse.net's web analytics statistics. For an artist, that reinforces a practical point: one platform rarely explains the entire fan journey.
Conversion and retention protect the business
Conversion measures whether attention leads to an action you can value, such as a ticket purchase, download, subscription, or merch order. Retention measures whether those people return and continue supporting the work. Together, they distinguish a momentary audience from a durable business.
The career metric is not the loudest number. It's the behavior that brings a listener closer to supporting the next release.
Types of Analytics in the Music Industry
Different analytics types answer different questions. Start with the decision you need to make, then choose the data category that can answer it.
Audience analytics describes who listens and where those listeners are located. Use it to identify promising cities, understand audience segments, and decide which markets deserve more promotion. Treat demographic information as directional context rather than a complete portrait of a person.
Content analytics compares songs, videos, posts, and releases. It can show which material attracts attention, which earns repeat behavior, and which formats prompt sharing. Artists use it to separate a strong song from a strong campaign asset. A track might perform well in streaming while a live performance clip creates more direct conversation.
Sales analytics follows money from purchases, subscriptions, tickets, and merchandise. It answers whether attention is becoming revenue and which products or offers attract buyers. Sales data should be tied to the campaign or release source whenever possible, otherwise you may know what sold without knowing why.
Marketing analytics evaluates promotion across social posts, email, paid campaigns, creator partnerships, and other channels. Focus on actions after the click, not just impressions or views. A smaller campaign that sends qualified fans to a store can be more useful than a broad campaign that produces passive exposure.
For practical music-business context, artists can also explore the OohYeah magazine alongside their platform reports. The key is to avoid reading each channel in isolation.
Separate vanity metrics from working metrics
A total follower count is easy to celebrate but hard to act on by itself. A stream-to-sale conversion rate, a repeat listener pattern, or sales by campaign source gives you a clearer next move. If a post earns attention but no meaningful follow-up behavior, change the message, offer, audience, or destination before spending more effort on it.
Interpreting Data for Actionable Insights
Collecting data is the easy part. Interpretation starts when you ask why a number moved and what response is justified.
Suppose one city produces stronger comments, repeat listening, and ticket interest than other locations. The correct response isn't automatically to book a show there. First, check whether a local promoter, playlist, radio outlet, collaborator, or community account explains the concentration. Then compare the cost and likely value of a targeted campaign with the cost of treating the entire country as one audience.
A second example is a release with high streams and weak retention. That pattern can point to broad discovery without a strong reason to continue. Review the creative used to promote the track, the listener journey after the first play, the follow-up content, and the next offer. Don't call the campaign a success because one top-line metric looks impressive.

Use a decision chain
A practical interpretation workflow looks like this:
- Locate the change. Identify the song, channel, audience group, territory, or date range where behavior shifted.
- Check the surrounding behavior. Compare streams with engagement, audience growth, conversion, and retention rather than reading one figure alone.
- Form a testable explanation. Ask whether the cause was creative, distribution, timing, targeting, pricing, or the fan journey.
- Make one controlled adjustment. Change the next post, landing page, offer, or campaign audience so you can learn from the result.
- Record the decision. Keep a short release log showing what you changed and what happened afterward.
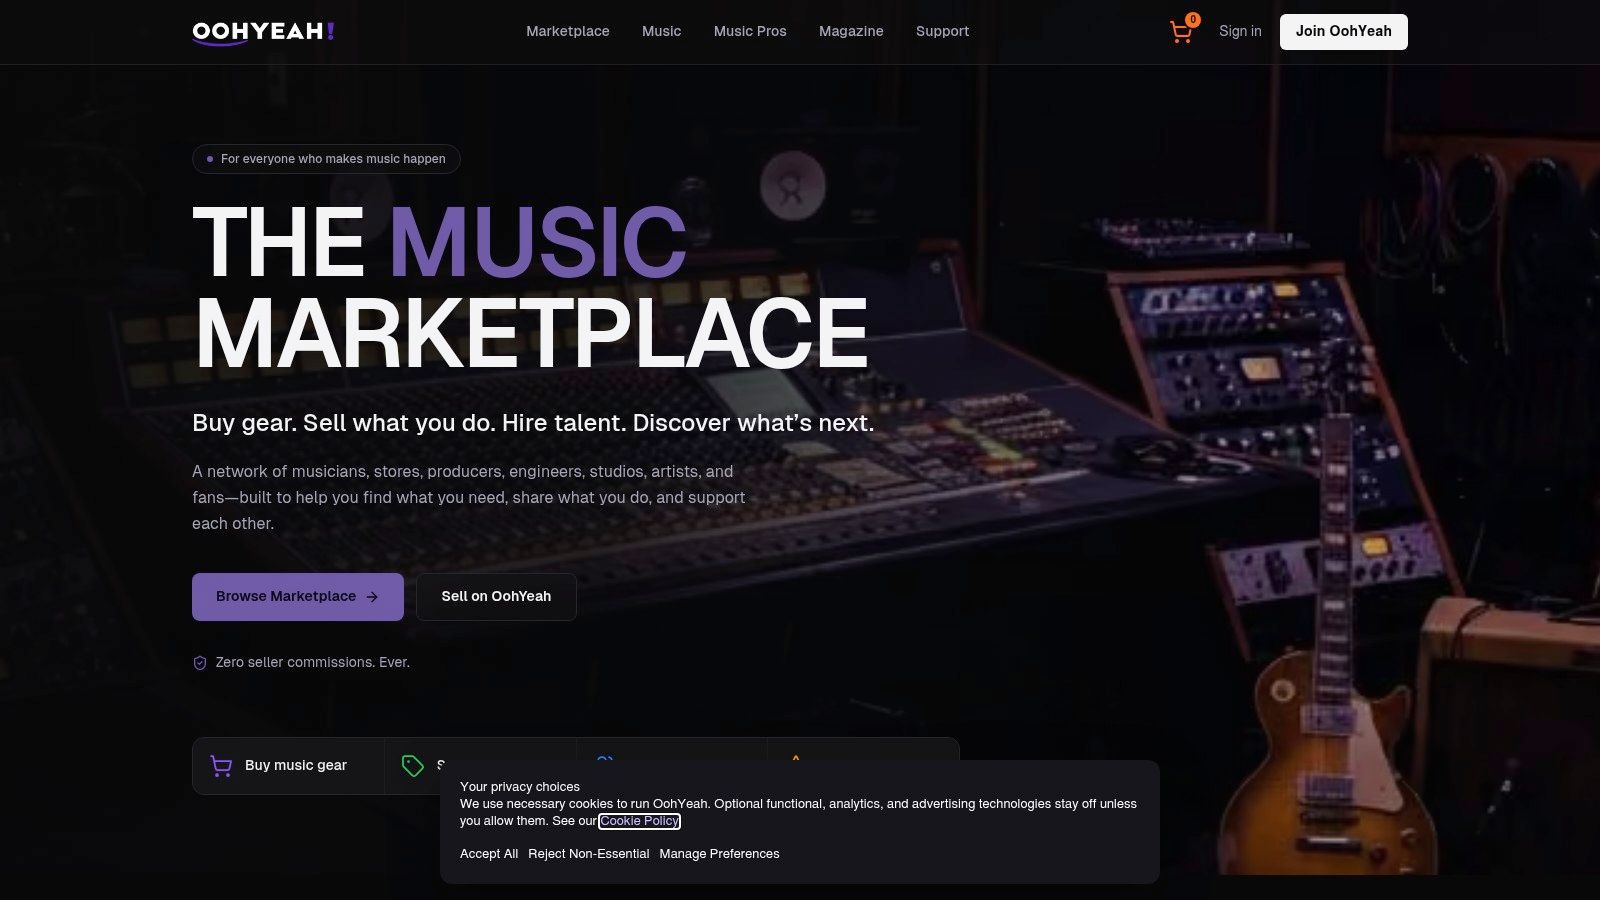
OohYeah can provide a music-first view across activity such as followers, comments, likes, sales, shares, and subscribers. Its relevance is practical: an artist can examine audience response alongside sales and subscription behavior instead of treating every platform as a separate island. More information about how the platform works is available in the OohYeah FAQ.
The strongest insight often appears between systems. A social post may look ordinary by engagement standards but still send high-value visitors to a product page. A song may have modest reach yet create the most subscribers. The job of analytics isn't to crown the biggest number. It's to identify the behavior that supports your next business decision.
Using OohYeah Analytics for Career Growth
Independent artists often receive delayed, fragmented reporting. A distributor may show streaming activity, a social platform may show engagement, and a separate shop may show orders. That setup can work for basic monitoring, but it makes attribution and interpretation harder because the artist has to reconstruct the fan journey manually.
A direct-to-fan ecosystem changes the question. Instead of asking only whether people listened, you can examine whether they interacted, followed, shared, subscribed, or purchased within a connected environment. OohYeah offers analytics related to followers, comments, likes, sales, shares, and subscribers, as well as insights into sales and subscriptions.
Compare reporting models
| Traditional fragmented reporting | Direct-to-fan analytics |
|---|---|
| Streaming, social, and shop activity often sit in separate reports | Music, interaction, and commerce signals can be reviewed together |
| Artists may see outcomes without a clear source | Artists can investigate the path from attention to action |
| Reporting often supports retrospective review | Ongoing activity can inform the next campaign or offer |
| Fan value remains difficult to distinguish | Subscriptions, purchases, and repeat activity provide stronger intent signals |
Neither model removes the need for judgment. A unified view can still mislead you if event definitions are inconsistent, attribution is unclear, or the data is incomplete. Analytics tools are consumption layers over pipelines and modeled data, so inconsistent definitions can produce dashboards that disagree even when they use the same underlying source, as outlined in Datalere's technical analytics glossary.
Apply the view to real decisions
Use sales and subscription reporting to learn which offers attract support. Compare product performance with the audience activity surrounding each promotion. If one campaign earns attention but another produces more subscriptions, the second may deserve more budget even if its public engagement looks quieter.
Use follower and comment patterns to shape community content. Review shares to identify material fans are willing to distribute for you. Then connect those signals to release planning, merch design, pricing, and event outreach. The point isn't to chase every fluctuation. It's to build a repeatable operating view that helps you spend limited time on the actions closest to career growth.
Artists evaluating the broader platform can review OohYeah for artists and decide whether its connected streaming, selling, and fan-interaction workflow fits their business model.
Building a Data-Informed Creative Strategy
Data shouldn't choose your sound. It should help you decide how to introduce, distribute, and monetize the sound you choose.
Artists get into trouble when they confuse audience behavior with creative instruction. If a short clip performs well, that doesn't prove every future song should imitate it. If a serious track receives fewer immediate plays, that doesn't make it artistically invalid. Analytics describe observed behavior. They don't replace taste, craft, instinct, or the risk that makes a release distinctive.
Let intuition lead the art
Keep creative decisions grounded in the work. Write the song that belongs in the project, develop the visual language that feels credible, and choose collaborators who strengthen the result. Then use data to determine how to reach the listeners most likely to respond.
That division of labor creates clarity:
- Use audience data to prioritize cities, communities, and outreach partners.
- Use content data to choose which clips, stories, and live moments deserve promotion.
- Use conversion data to refine product bundles, ticket offers, and subscription prompts.
- Use retention data to plan follow-up communication instead of abandoning fans after release week.
A weekly review is enough to establish discipline if you keep it focused. Examine the same core measures, note meaningful changes, and write down one decision for the next cycle. Don't rebuild your strategy around every small movement. Look for patterns that persist across related releases or campaigns.
Protect the fan relationship
Privacy and governance matter even for a small artist. Collect only the information you need, explain the value of direct communication, control access to reports, and avoid treating personal audience data as a commodity. Trend monitoring from BARC's Data, BI and Analytics Trend Monitor 2026 identifies data quality management and data security and privacy among leading priorities, especially as AI-assisted analytics becomes more common.
AI can summarize a change or surface an anomaly, but it can't repair a badly defined metric or an incomplete fan journey. Before asking a tool for recommendations, make sure you know what counts as a stream, an engaged listener, a subscriber, and a sale in your own operation.
The artist owns the creative direction. The dashboard earns a seat in the business meeting.
The practical outcome is a feedback loop: create with conviction, promote with evidence, review the response, and adjust the next business action. That approach gives independent musicians the discipline of a serious company without forcing the music into a formula.
OohYeah brings streaming, selling, subscriptions, fan interaction, and related analytics into a music-first ecosystem for creators. Visit OohYeah to review how its tools can help you connect audience behavior with practical decisions about your next release, offer, or campaign.