How to Track Sales Performance: Boost Sales
Learn how to track sales performance for music, merch & subscriptions. Define KPIs, build dashboards, & make data-driven decisions for artists.
August 10, 2026
Music Marketplace Advisor
Buying & SellingYou drop a track, post the merch, maybe open a subscription tier, and then the numbers start trickling in. A few downloads here, a couple shirts there, some fans clicking but not buying, and it can feel like you're staring at a blurred map instead of a real career path. How to track sales performance is the move that turns that blur into signal, so you can see what's building momentum and what's just busy noise.
For independent artists, that means treating music, merch, and fan support like a single business with multiple income streams, not a pile of random stats. The same logic that helps a sales team see where a deal is moving or stalling also helps you see where a release, design, or subscription offer is pulling its weight. If you need a practical starting point for the artist side of that system, this creator-focused setup gives you a clean place to begin.

A lot of artists also waste time chasing the wrong kind of attention. If a post gets views but no sales, or a video gets comments but no subscribers, you still need to know whether the content is moving fans toward a purchase. For that side of the strategy, mastering viral video content is useful because it helps you think about what captures attention before the sale happens.
Beyond Streams Turning Data into a Career Compass
A new release can feel like shouting into the void. You spent time on the track, the artwork, the merch mockups, and the announcement, then you refresh the dashboard and ask the same question every artist asks, what does this mean?
The answer starts with looking at sales performance as a compass, not a scoreboard. A scoreboard only tells you who won after the fact. A compass tells you whether the work you're doing today is pointing toward more revenue, stronger fan relationships, and less guesswork next month.
That shift matters because artists don't live on streams alone. One song may drive merch interest, another may lead fans into a subscription, and a well-timed post may revive older catalog sales. You're not just counting transactions, you're watching how attention becomes income.
A good way to keep that view practical is to move from chaos to structure. If your numbers sit in different places, start with one place where your music, merch, and subscription performance live together, then check what each fan action is leading to.
Practical rule: if a metric doesn't help you make a decision, it's noise.
If you're serious about how to track sales performance as an independent creator, that decision-making lens matters more than vanity totals. A fan who buys once after a targeted post is more useful data than a big but empty spike in attention, because it tells you where the path to income is proving effective.
Defining Your Key Performance Indicators
Before you track performance, decide what performance means in your world. For artists, that usually isn't just revenue. It's whether people are discovering your work, engaging with it, buying from it, and coming back for more.
The cleanest framework is the one used in sales operations, leading indicators and lagging indicators. Leading indicators are the actions that build the pipeline, like outreach, meetings, or follow-ups in a sales team, and for you that can look like posts published, fans reached, email signups, or merch page clicks. Lagging indicators are the outcomes, like revenue closed, win rate, or churn in a sales business, and for artists that means sales, subscriptions, repeat purchases, and overall income results. This split is the foundation of modern sales dashboards because it lets teams review activity daily or weekly and outcomes monthly or quarterly, as described in Everstage's sales performance tracking guidance.
What this means for an independent artist
Use leading indicators to catch momentum early. If a release is getting saves, clicks, and message replies, you've got evidence that the offer is getting attention before the money lands.
Use lagging indicators to judge whether that attention turned into cash. A lot of artists stop at engagement, but the ultimate question is whether the fan behavior led to a sale, a subscription, or a merch order.
A simple table can keep the categories straight:
| Category | Leading Indicator (Effort) | Lagging Indicator (Result) |
|---|---|---|
| Music | Posts, links shared, teasers published | Track sales, downloads, revenue closed |
| Merch | Product page views, launch posts, fan replies | Shirts sold, total merch revenue |
| Subscriptions | Membership promos, direct messages, live asks | New subscribers, retained members |
| Fan growth | Email captures, link clicks, profile visits | Repeat buyers, recurring income |
Keep the list short. A practical system usually works best when you track only a few KPIs per business area, because a crowded dashboard hides the numbers that matter. For portfolio-style thinking about presentation and clarity, performance metrics for portfolio sites offers a useful way to think about clean measurement.
If you want a stronger artist workflow, pair those KPIs with a simple reference guide in the OohYeah guides hub. That helps you keep definitions consistent so you're not comparing apples to oranges every time you check the numbers.
Centralizing Your Data Sources
Artists lose time when every revenue stream lives in a different place. Music sales may sit in one dashboard, merch in another storefront, and subscriptions somewhere else. If you're trying to understand the business, scattered data turns every review into a scavenger hunt.
Centralizing your numbers is the first real fix. The point is to create one place where you can see what fans are buying, how they found you, and which offers are moving. That single source of truth makes it easier to compare releases, spot patterns, and stop guessing which channel deserves your attention.

For artist-first workflows, OohYeah's real-time analytics are built around that kind of centralized view, so music, merch, and subscriptions can be monitored together instead of across disconnected tools. That matters because you can compare content to outcome more easily, not just count transactions.
Where the useful signals live
Start with the numbers already inside your main dashboard, then pull in any outside tools you still use for storefronts, mailing lists, or paid memberships. The goal isn't to chase every metric possible, it's to connect the few that reveal whether fans are moving forward.
The other part of centralization is content analysis. If a newsletter, reel, post, or short video leads to a spike in clicks or purchases, that's not random luck. It's a signal that your message matched fan intent.
Buyers don't need more content, they need the right answer at the right moment.
That's why sales tracking should include whether your content is helping fans make decisions. A strong gap-analysis approach maps each asset to the buyer journey and checks whether people engage and move forward after using it, which is exactly the kind of thinking reflected in Paperflite's content gap audit guidance.
If you want a more structured learning path for organizing your own data sources and fan offers, these artist courses are a practical place to sharpen the system without turning it into corporate busywork.
Building Your Simple Artist Dashboard
A dashboard should answer questions fast. If it takes five minutes of squinting and scrolling to figure out what happened this week, it isn't a dashboard, it's a spreadsheet with a nicer font.
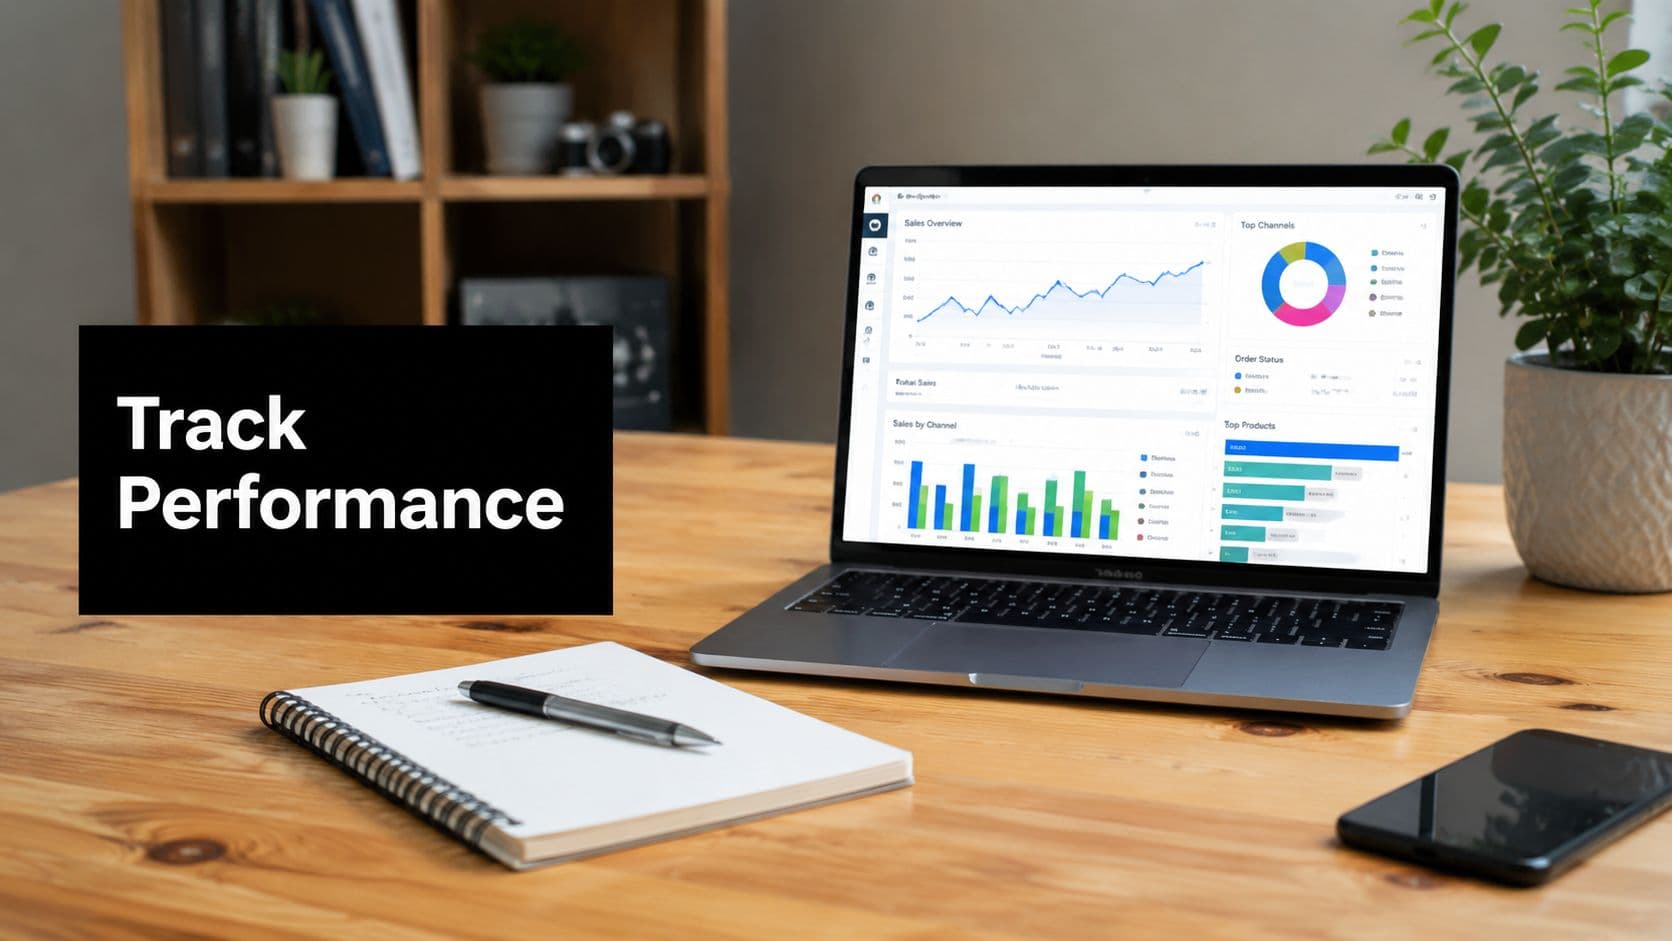
The best artist dashboard is narrow, not ambitious. Pick a few core KPIs and separate them by cadence, so one view tells you what happened this week and another tells you what happened over the month. That reflects the layered model used in sales operations, weekly activity, monthly pipeline, and quarterly outcomes, with one dashboard per cadence instead of one overloaded screen, as recommended in Ahead of Sales' tracking guide for managers.
A simple layout that actually gets used
For weekly review, show the numbers that reveal motion. New followers, link clicks, email signups, merch page visits, and direct messages are all useful if they help you see whether people are moving closer to a purchase.
For monthly review, focus on outcomes. Revenue by product type, subscriber growth, repeat purchases, and total sales by release tell you whether the weekly actions translated into money.
A dashboard can stay readable if you keep the design disciplined:
- Top row: current totals for music, merch, and subscriptions.
- Middle row: the main leading indicators for the week.
- Bottom row: the lagging indicators that show monthly results.
- Trend view: one line chart for momentum over time.
- Comparison view: one bar chart for product or release performance.
The chart choice matters. Line charts are better for trend movement, while bar charts are better when you want to compare releases, shirts, or membership offers side by side. This keeps your attention on decision points, not decoration.
If you're building the first version yourself, Google Sheets is enough. If you're already inside OohYeah analytics, customize the visible metrics so you're not forced to dig for the same answer every time. Either way, the dashboard should serve your review rhythm, not the other way around.
How to Interpret Trends and Take Action
Numbers only matter when you know what to do with them. A spike, a dip, or a flat line is just a shape until you connect it to an action, a campaign, or a fan behavior shift.
The modern sales approach is to watch data continuously instead of waiting for a month-end reset. Sales guidance from Zendesk's performance metrics overview emphasizes real-time CRM-based measurement and regular review cadences, daily for volume, weekly for appointment-setting, and monthly for win rate, so teams can detect gaps early and adjust coaching or forecasting. For an artist, that same rhythm works when you're watching product launches, audience response, and checkout behavior.

Read the story behind the number
If an older track suddenly starts selling again, don't just celebrate the sale. Check where the traffic came from, which post or mention drove it, and whether fans are moving from that track into merch or another offer. That tells you whether to repost, repackage, or build a new campaign around the same angle.
If a merch item gets page views but no sales, the interest is there and the friction is somewhere else. The issue could be the design, the copy, the price presentation, or the checkout path. The fix isn't always to shout louder, it's to remove the obstacle that's stopping the purchase.
A direct message poll can help when the issue is product fit, not demand. Ask fans what design they'd wear, which color they'd buy, or whether they want bundles instead of one-off items. That feedback gives you a practical reason to adjust the offer before you relaunch it.
Turn the interpretation into action
- If attention is high but sales are low, simplify the offer and make the buy step obvious.
- If an older release is selling, reuse the hook, caption style, or visual format that revived it.
- If subscriptions lag, make the membership benefit more concrete and easier to understand.
- If fans keep asking the same question, put the answer in the content before they have to ask again.
That last point matters because sales tracking is also about whether the team is equipping buyers with the right answers. When your posts, descriptions, and DMs solve confusion quickly, fans move faster and the data gets cleaner.
Setting Targets and Your Review Cadence
Goals work only when they're specific enough to check. “Sell more merch” sounds motivational, but it doesn't tell you what to do this week. “Sell more shirts” becomes useful only when you attach a measurable target and a deadline to it.
The sales playbook here is straightforward. Expert guidance recommends tracking 6 to 10 core metrics on a fixed weekly cadence, usually 3 to 4 leading indicators and 3 to 4 lagging indicators, because monthly-only review often catches problems too late to fix, as noted in Prospeo's sales tracking guide. That cadence works for artists too, because it keeps you close enough to the numbers to react without living in the dashboard.
A cadence that won't burn you out
Use a short weekly review for activity. Check whether you posted, followed up, promoted the right products, and gave fans a clear next step.
Use a monthly review for outcomes. Look at which items sold, which release drove sales, and whether subscribers or repeat buyers moved in the right direction.
Use a quarterly review to prune the dashboard. If a metric never predicts anything useful, drop it. If another one keeps revealing where fans convert, keep it.
Consistency beats intensity. A quick weekly habit will beat a stressful deep-dive every few months.
A practical target should connect the effort and result. You can set a goal around product movement, subscription growth, or release-driven revenue, then watch the weekly indicators that should lead there. That lets you catch weak spots before the end of the month instead of discovering them after the opportunity's gone.
The strongest artist systems are simple enough to maintain even when you're on tour, recording, or handling everything yourself. That's the essential measure of how to track sales performance, not whether the dashboard looks impressive on day one.
OohYeah gives independent artists one place to manage music, merch, subscriptions, and the analytics behind them, so you can see what's selling without stitching together a dozen tools. If you want a cleaner way to turn fan activity into income, visit OohYeah and build a tracking system that fits the way you release and sell.